

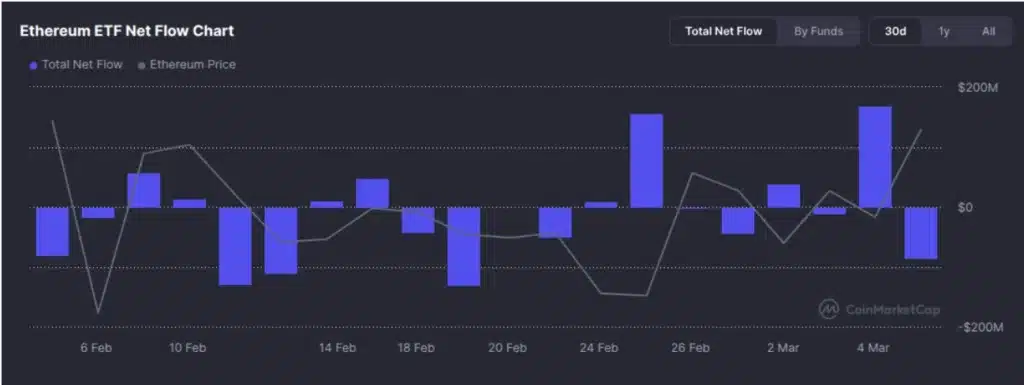
The digital asset space has witnessed a major shift in the past week, with the spot Ethereum exchange-traded funds witnessing the highest net flows in the past two months. According to the data, the spot ETFs have witnessed a cumulative investment of $169 million in a short time of trading. This is viewed positively for Ethereum, which has been trying hard to attract investors, especially when compared to its predecessor, Bitcoin.
Also Read: Ethereum Price Prediction (2026-2030)
Experts in the field have attributed the sudden rise in Ethereum ETFs to the rising “buy the dip” sentiment among hedge funds and institutional wealth managers. This comes after weeks of stagnant Ethereum prices, with small outflows in the past two months. This $169 million worth of investments in Ethereum is seen as a vote of confidence by the investors in the long-term prospects and the current prices.
Institutional Leaders and Fund Performance
The Ethereum ETFs have seen BlackRock’s iShares Ethereum Trust (ETHA) take the lead, which is seen as a major positive sign for the asset, especially when compared to its peers. According to market data, BlackRock’s ETF has seen a substantial lead over other ETFs, especially when it comes to daily volume, followed by Grayscale Ethereum Mini Trust (ETH).
The Ethereum market has seen its legacy product, Grayscale Ethereum Trust, commonly referred to as ETHE, experience some “bleed” over the last two months, especially as new ETFs with lower fee structures have gained favor. This is seen as a positive sign, especially since this trend is expected to continue over the coming months. This trend is similar to what is seen with Bitcoin ETFs, where legacy products have seen their market share eroded by new ETFs with lower fee structures.
Ethereum Price Breaks Resistance
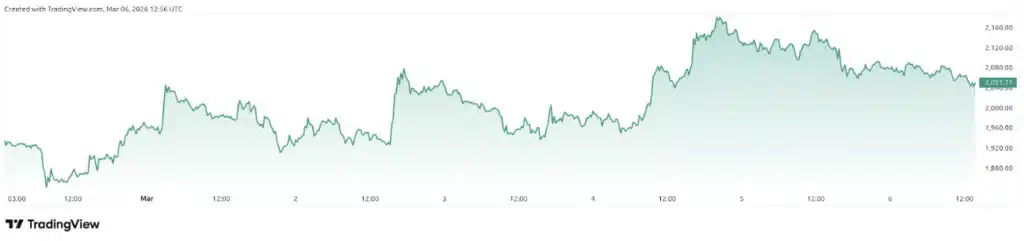
The increase in the demand for ETFs also coincides with the price breakout of Ethereum. As the asset consolidated in a tight range for the entire month of February, eventually broke through the resistance level of $2,000. As the asset tested the price level of $2,130, this is the highest that the asset has traded in recent weeks.
As the price of Ethereum increased, market observers have noted that the asset also witnessed an increase in its trading volume, which rose by 22 percent. As the price of the asset increased, technical analysts have noted that the price breakout is due to the breakout of the asset from its symmetrical triangle formation, which was visible on the daily charts.
The Bitcoin Correlation and Macro Factors
As the price of Ethereum increases, the asset cannot be analyzed independently. As the price of the asset increases, the price of the asset, namely Bitcoin also witnessed an increase. As the price of the asset traded near the price range of $72,000 to $73,000, the increase in the price of the asset is due to the steady increase in demand for the asset, as investors believe that it is an undervalued asset, considering the recent price breakout of the asset.
As the price of the asset increases, the economic factors have also played an important role. As the United States witnessed an increase in the regulatory environment, particularly with the proposed CLARITY Act, the entire asset class witnessed an increase in price. As investors believe that the asset class is an excellent hedge against financial market volatility, the increase in the price of the asset is also due to the geopolitical factors that have been affecting the market.
Looking Ahead: Resistance and Support Levels
Despite the positive developments, analysts remain cautious about the market. The reason behind their cautious approach is based on the fact that a major portion of the market is being sold at a loss, and the short-term investors who have been involved in this practice may opt to sell their assets if the market experiences a major correction. Regarding the market, the resistance level is located at around $2,400.
Based on the rate at which institutional investors are currently investing in the market, the market might be able to enjoy a strong rally towards the $2,800 resistance level. When it comes to the downside, the $1,920 level has flipped from a resistance zone to a high volume zone. Traders are currently waiting to see how the next round of ETF filings will affect the market, especially after the $169 million inflow seen this week.
Summary of Market Sentiment
The overall sentiment of the market, especially in the Crypto Twitter community, has shifted from being apprehensive to being guardedly optimistic. This has been observed by the movement of the Fear & Greed Index, which has moved out of the neutral zone. This indicates that the overall sentiment of the market is improving.
“We are seeing a measured recovery after the early-year correction. The market is shifting from a sell-off phase to a stabilization phase. Sustained institutional inflows are the fuel needed to turn this stabilization into a new bull leg.”
As the week comes to a close, all eyes are on the Ethereum spot ETFs, which might be necessary to send the market higher towards the yearly highs, especially if it is able to maintain a streak of net positive inflows until the middle of March.
Disclaimer: BFM Times acts as a source of information for knowledge purposes and does not claim to be a financial advisor. Kindly consult your financial advisor before investing.
Why are Ethereum ETFs seeing higher inflows recently?
Ethereum ETFs attracted strong investor interest due to growing confidence in ETH and improving crypto market sentiment.
How much inflow did Ethereum ETFs record recently?
Ethereum ETFs recorded about $169 million in inflows, marking the highest level in the past two months.
What does the rise in Ethereum ETF inflows indicate?
The increase suggests growing institutional demand and renewed optimism around Ethereum’s long-term potential.