
Introduction
When we think about doing trading, then we must think about what to trade, how to trade, and when to trade, and these questions are simply answered by indicators – that is, basically trading indicators RSI. Indicators are used for technical analysis of the movement of price along with market fluctuations, and to predict future movement. One of the most popular trading indicators is RSI, which stands for Relative Strength Index. Here we will discuss, how it works, and how to analyse it.
What is RSI?
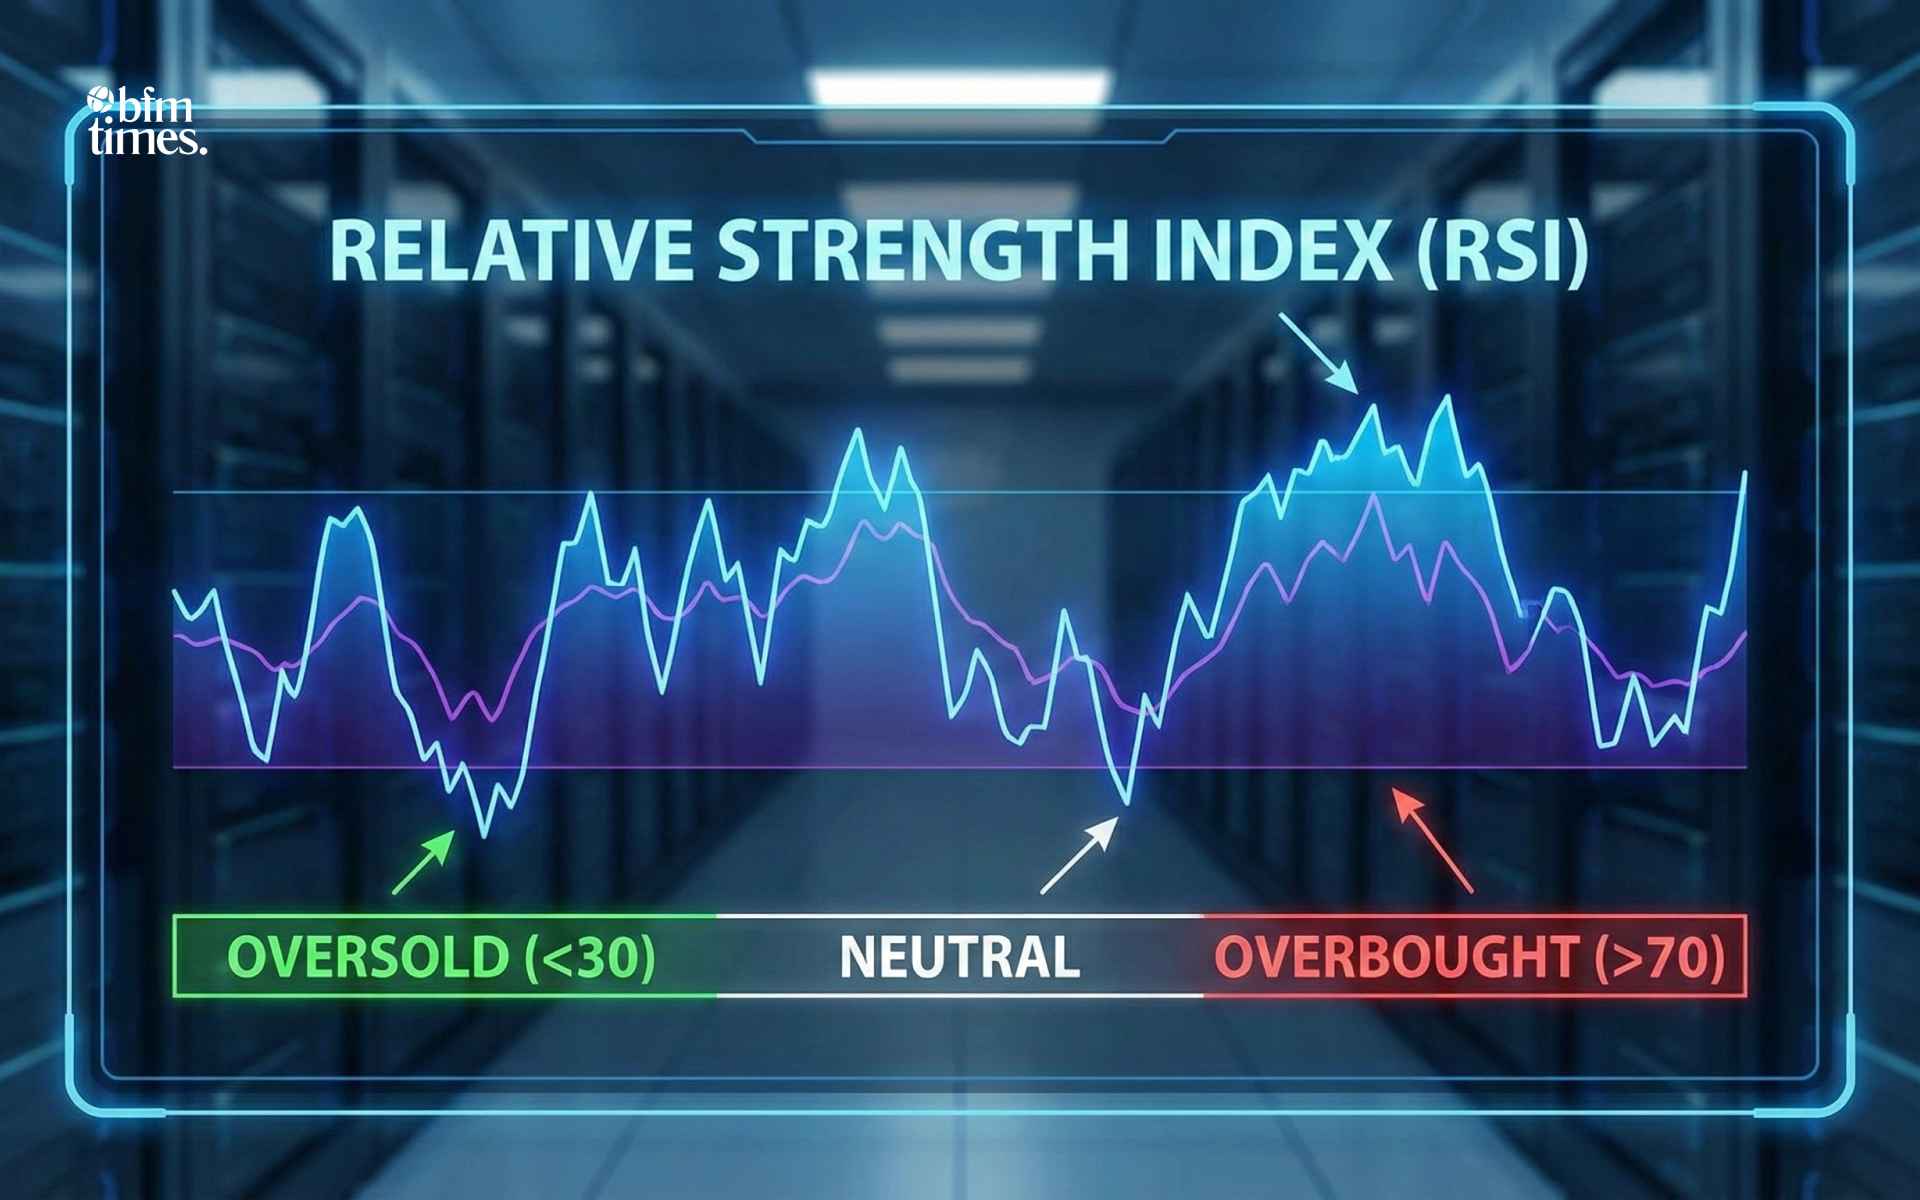
The Relative Strength Index is basically a momentum indicator. It is used to measure or predict the movement of the market, either upside or downside, along with the intensity of this movement. It ranges between 0 and 100 and tells us whether any stock or asset is overbought or oversold.
How it works
It works on the data of the past 14 days and analyzes the price fluctuations. Its graph is shown separately below the price chart, and its value fluctuates between 0 and 100:
Some specific cases
If its value is more than 70, then it indicates that the market is in an overbought condition. This also indicates that if the price has increased very rapidly, it can be a sign that there may be a fall in price in the near future.
If its value is below 30, it indicates that the market is oversold, as the price of the commodity has fallen very low, and it can be a sign that it may rise in the near future.
For example, if for any coin or asset is 80, then it means that the market is overbought and the price is at its peak, so in the near future it can have a downward pullback.
What RSI tells us
It gives signals about:
- Overbought and oversold signals
- It shows overbought when the value of RSI is above 70.
- It shows oversold when the value of RSI is below 30.
Divergence signal
If the price chart and line move in different directions, then it can be a strong indicator of:
Bullish divergence
If the price is regularly falling but the RSI is increasing, it can be a sign that there will be a reversal.
Bearish divergence
If the price is moving rapidly upward but the RSI is falling, then it can indicate a possible bearish reversal.
Use of RSI in trading
RSI can be used alone or along with some other indicators so that a more reliable signal can be achieved, such as:
Traders can get a buying signal when moves above 30 from below.
Traders can get a selling signal when moves below 70 from above.
RSI can be used with MACD to get a stronger signal.
Why use RSI
- It gives signals that are easy to study and understand.
- It helps in identifying overbought and oversold conditions.
- It can give more precise predictions when combined with other indicators.
Precaution
RSI will not always give the right indication; sometimes, in long trending market conditions, it can remain in an overbought or oversold condition for a longer time. To control trading risk, stop-loss features must be used.
Conclusion
The RSI indicator is an efficient and strong technical tool that indicates the status of market movement and helps in predicting reversals. It is very helpful for traders who focus on planned trading and proper research. The RSI indicator is useful for both intraday traders and swing traders if used effectively.
Disclaimer: BFM Times acts as a source of information for knowledge purposes and does not claim to be a financial advisor. Kindly consult your financial advisor before investing.
Disclaimer: BFM Times acts as a source of information for knowledge purposes and does not claim to be a financial advisor. Kindly consult your financial advisor before investing.