By using this site, you agree to the Privacy Policy and Terms of Use.
Accept

Global Decentralized Hackathon Show – Register Here

BFM Times
Trending Event
  • Home
  • BFM Talks
    • Finance
    • Startup
    • Investment
    • Web3
  • Press Release
  • Partners
  • Events
  • Market Live
  • Converter
  • Exchanges
  • Accelerator
  • Contact Us
Reading: Support and Resistance in Trading
Share
  • bitcoinBitcoin(BTC)$91,309.00
  • ethereumEthereum(ETH)$3,130.70
  • tetherTether(USDT)$1.00
  • rippleXRP(XRP)$2.16
  • binancecoinBNB(BNB)$889.73
  • solanaSolana(SOL)$138.18
  • usd-coinUSDC(USDC)$1.00
  • tronTRON(TRX)$0.294697
  • staked-etherLido Staked Ether(STETH)$3,129.56
  • dogecoinDogecoin(DOGE)$0.142798
Trending Event
  • Accelerator
  • Finance
  • Investment
  • Web3
  • Featured
  • Startup
  • News
  • Educational
  • Price Analysis
Search
  • Home
  • BFM Talks
    • Finance
    • Startup
    • Investment
    • Web3
  • Press Release
  • Partners
  • Events
  • Market Live
  • Converter
  • Exchanges
  • Accelerator
  • Contact Us
Have an existing account? Sign In
Follow US
  • Home
  • BFM Talks
  • Press Release
  • Partners
  • Events
  • Market Live
  • Converter
  • Exchanges
  • Accelerator
  • Contact Us
© 2025 All Rights Reserved.
BFM Times > Blog > Investment > Support and Resistance in Trading
Investment

Support and Resistance in Trading

Dhirendra Das
Last updated: January 6, 2026 1:08 pm
Dhirendra Das
Published: January 6, 2026
Share
Supports and Resistance
SHARE

Support and resistance are levels used in technical analysis to interpret price movement in any stock or asset in the market. It is the point at which the price of assets or commodities stops rising or reverses its direction. It is essential to identify this level to make informed, better decisions about entry, exit, and risk management.

Contents
  • Definition
    • Support
    • Resistance
  • Significance
  • Importance
  • Practical Use
  • Benefits
  • Disadvantages
  • Conclusion

Definition

Support

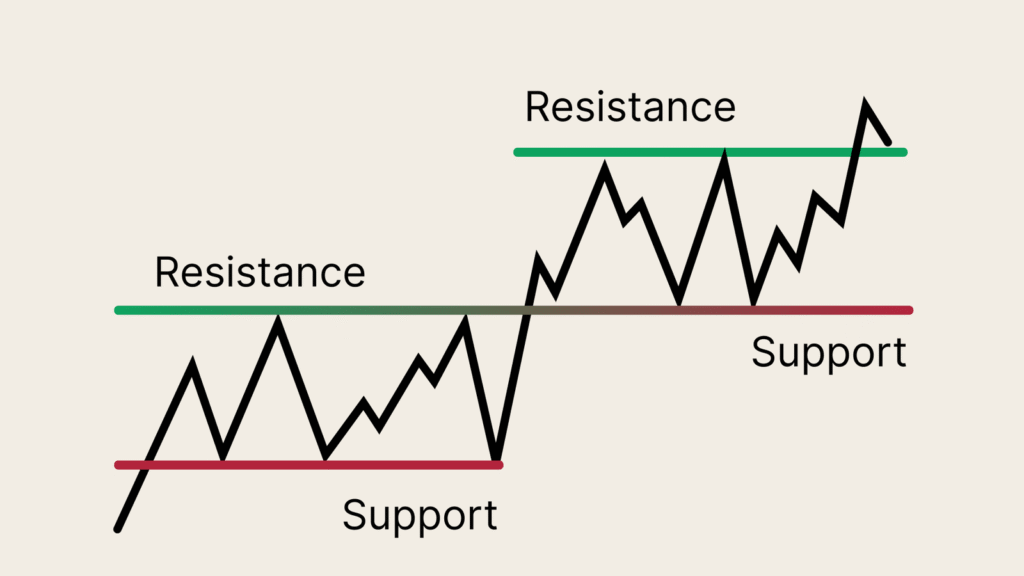
This is the level at which the declining price of any stock stops falling and reverses its direction for upward price movement. This acts as the floor of price movement. It is essential for investors to find this point for investment and earning profits.

Resistance

It is a point at which the increasing price of any commodity or asset stops and starts declining. This acts as the roof of price movement. It is helpful for investors to sell their commodities or assets at that point to prevent further decline and losses.

Given below is the graph which illustrates both support and resistance levels:

Major & Minor Support and Resistance 📊 pic.twitter.com/cCV68rAA0o

— Mybookmojo (@mybookmojo) December 25, 2024

Significance

Support and resistance are the elements that indicate the direction of trading and provide entry and exit points, as well as the psychological nature of investors. If the price graph touches the support or resistance level several times, then its significance becomes greater and helps to make informed decisions in the future. It also proves the fact of price reversal in a market that tends to follow a certain price wave.

Importance

To make a properly planned decision for trading, to find out the ideal place for entry and exit in the market.

Helps in risk management by finding an ideal stop loss.

Indication of breakout and breakdown that will lead to a new resistance and support level.

Practical Use

  • To find out the entry point, that is, investing at the point where the price level is near the support level.
  • To find out the exit point, that is, selling commodities or assets at the price level when it is near resistance.
  • To analyse and prepare for breakout trading, when price movement breaks down from the support or resistance level.
  • It acts as an approach to buying trades or assets at the time of trend reversal.

Example

Let’s assume the stock is named Bank Nifty and it is trading at 45000.

But when it reaches 46000, it sells down again and again; then 46000 is basically the resistance level.

And when it reaches 44000, it moves upward again and again; then 44000 is basically the support level.

Benefits

  • It is easy to understand and effective for finding a better time for entry and exit.
  • Can be used in any time frame for better analysis.
  • Effective in preventing losses.
  • Can be used for any market, such as the share market, crypto market, etc.
  • Helps in risk management.

Disadvantages

  • Several times it shows false breakouts that can again retrace to its normal pathway in the future.
  • It has wider subjectivity; that is, different traders analyse the same chart with different perspectives and outcomes.
  • In a volatile trading market, it is less effective.
  • Basically, it depends on the history of price movement and therefore predicts the support level around the resistance level, so we cannot rely on it fully.

Conclusion

Support and resistance are trending and practical predictive tools. Proper utilisation of this tool, along with sound research and management, can lead to better profitability, but relying solely on it can also result in losses. Precautions are necessary while using this tool, and it can be integrated with other indicators for more effective decision-making.

Disclaimer: BFM Times acts as a source of information for knowledge purposes and does not claim to be a financial advisor. Kindly consult your financial advisor before investing.

Moving Average Convergence Divergence (MACD): Definition, Usage, Benefits & Examples
What is Buying The Dip in Investing?
How Does Future Trading Work?
What is Dollar Cost Averaging or DCA in Investing?
Leverage Trading: Meaning, Benefits, and Risks
Share This Article
Facebook Email Copy Link Print
Previous Article Moving Average Convergence Divergence (MACD) Moving Average Convergence Divergence (MACD): Definition, Usage, Benefits & Examples
Next Article Short Squeeze Explained Short Squeeze Explained: A Beginner’s Guide for Traders and Investors
Leave a Comment

Leave a Reply Cancel reply

Your email address will not be published. Required fields are marked *

- Advertisement -
Ad image

Latest Posts

ETFs
First Daily Outflows Hit XRP ETFs As Nearly $600 Million Leaves General Market
Web3 News
Bitcoin ATH
Bitcoin Needs To Cross These Checkpoints For A New ATH In 2026
Finance
Cubane BFM Times
Building Systems That Last: The Journey of Sundar Padmanabhan
Press Release
US Oil Stocks
Why US Oil Company Stocks Jumped After Trump’s Entry Into The Venezuelan Oil Sector
Web3 News

You Might Also Like

What if I Invested 1000 Rupees in Bitcoin in 2010?
Web3 FAQsInvestmentWeb3

What if I Invested 1000 Rupees in Bitcoin in 2010?

January 1, 2026
SOL Price prediction
Investment

Solana Price Analysis 2026

November 29, 2025
Option Trading Explained
Investment

What is an Option? Basics, Examples, Benefits, and Risks

January 6, 2026
Fibonacci Retracement
Investment

Your Assets Might Recover in 2026 if They are Close to These Fibonacci Retracement Ratios

December 28, 2025

Follow Us on Socials

We use social media to react to breaking news, update supporters and share information

Facebook X-twitter Instagram Linkedin Reddit Pinterest Telegram Youtube
BFM Times

For the Phenomenal Times

Quick Links

  • Privacy Policy
  • Press Release
  • Events
  • Partners
  • Submit Your Post
  • About Us
  • Advertise
  • Career
  • Contact Us

Newsletter

You can be the first to find out the latest news and tips about trading, markets...

Please enable JavaScript in your browser to complete this form.
Loading
Ad image
© 2025 All Rights Reserved.
Hot Wallet
Join Us!
Subscribe to our newsletter and never miss our latest news, podcasts etc..
Please enable JavaScript in your browser to complete this form.
Loading
Zero spam, Unsubscribe at any time.
Welcome Back!

Sign in to your account

Username or Email Address
Password

Lost your password?