


Key Insights
- Bitcoin Cash now holds firm above $518 after a recent test of the $520 support.
- Analysts are eyeing BCH as it moves further toward the $580 to $625 zone.
- Technical signals are all showing room for a steady upside move.
Bitcoin Cash has returned to focus as the price attempts to close above $600. The asset now hovers around the mid $530 range after defending support near $518, and this setup has drawn fresh attention from traders.
Can the cryptocurrency’s signs of strength translate into a breakout as the market signals stay mixed?
Bitcoin Cash Defends Support as Buyers Step In
Bitcoin Cash recently tested the $518 area and held above it. However, buyers stepped in during that move and slowed down the selling pressure. This response helped BCH stabilise near $535.
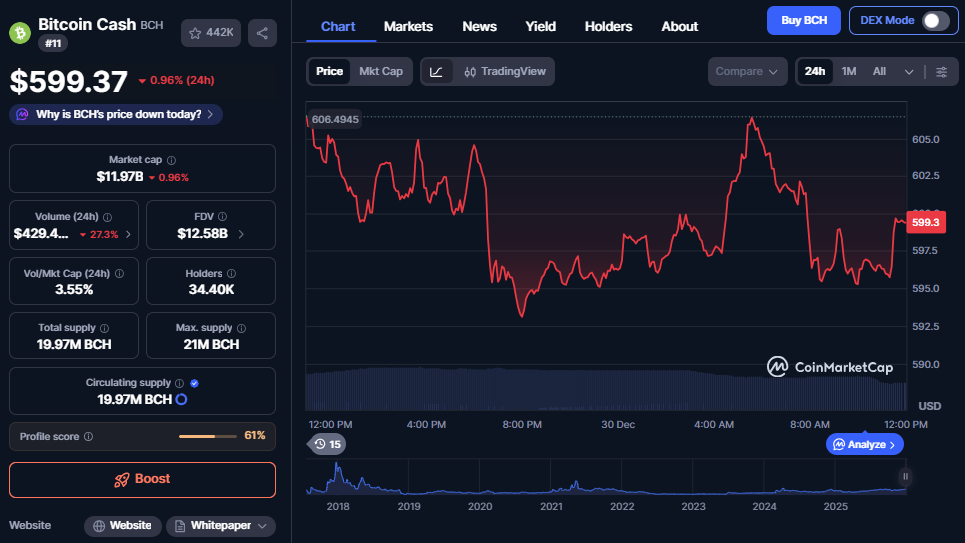
Price now trades above both the 50-day and 200-day simple moving averages around the $600 price level, and this shows that the longer trend is healthy.
This defence could also set the stage for further price action. Traders often view such levels as areas where confidence rebuilds after pullbacks.
Analysts Agree on Price Targets
Several analysts are now pointing to similar price targets, with many predicting BCH prices around $580 and $625 in the coming weeks.
This kind of alignment indicates that several analysts are saying the same things about the asset. Analysts are also noting that BCH needs a clean push above $607 to unlock further upside.
That zone lines up with recent upper price bands and past reaction points.
Some forecasts are also leaning higher and mention $650 as an extension level. These views depend on strong follow-through buying after a breakout.
Technical Signals Remain Balanced
The asset’s technical indicators currently show a mixed but encouraging picture. The relative strength index sits near 45 and this level indicates neutral conditions. In other words, price does not appear stretched in either direction.
This balance leaves room for upward movement without fast profit-taking as traders often prefer such setups when looking for trend continuation.
MACD readings are still showing short-term pressure, and this signal indicates recent selling but also often appears before reversals. When combined with solid support, such conditions can change very quickly.

As of writing, Bollinger Band positioning shows BCH trading in the upper portion of its recent range. As a worst-case scenario in the short term, the bears might successfully pull prices back toward the centre band near $560.
Bullish Path for Bitcoin Cash’s Price
The bullish case for Bitcoin Cash depends on clearing resistance near $607. A move above this zone would likely attract fresh buying interest.
Once above that level, analysts expect the price to test $625, as this zone aligns with retracement levels from prior highs.
Support from moving averages strengthens this scenario and holding above them often encourages trend traders to stay active.
RSI also has room to rise before reaching overheated levels. This allows the price to move higher without suffering immediate selling pressure.
If buying remains steady, BCH could approach $650 before the year ends. This outcome depends on the general market stability and follow-through volume.
Disclaimer: BFM Times acts as a source of information for knowledge purposes and does not claim to be a financial advisor. Kindly consult your financial advisor before investing.


