


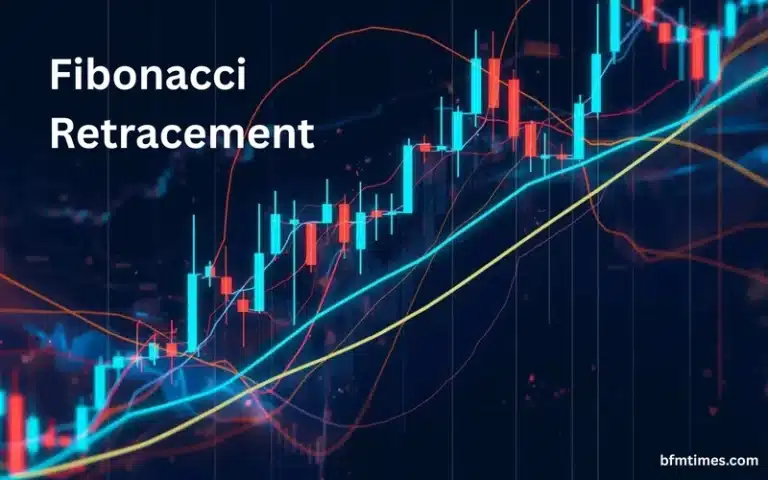
The Fibonacci retracement ratios are some of the most useful indicators that traders and investors have at their disposal in identifying the areas from where a downtrend might reverse. By 2026, as the crypto & stock market experience significant corrections, these mathematical levels provide investors with a roadmap on where to recover. The Fibonacci retracement ratios are derived from a sequence of numbers first identified by the mathematician Leonardo Fibonacci in the 13th century. These ratios appear in nature, architecture & financial markets across the world. This blog explains exactly what the key Fibonacci retracement ratios are, how they work in 2026 & why your assets may recover right at these critical levels.
What Are Fibonacci Retracement Ratios?
The Fibonacci retracement levels are particular percentage points at which the price may retrace or reverse its strong movement. The Fibonacci series starts from 0 & 1; the next number being the total of previous two numbers – 0, 1, 1, 2, 3, 5, 8, 13, 21, 34, 55, 89, 144. If these numbers are divided into one another, we get particular ratios that can be found on price charts repeatedly.
The key Fibonacci retracement ratios used in trading are 23.6 percent, 38.2 percent, 50 percent, 61.8 percent & 78.6 percent. The 61.8 percent level is known as the Golden Ratio & it is the most widely watched level in all of technical analysis. These levels are plotted as horizontal lines on a price chart & they show where support or resistance is likely to appear.
Why Do Fibonacci Retracement Ratios Work in 2026?
The Fibonacci ratio retracements are successful since they form psychological price levels. Traders from all around the world focus on these levels at the same point in time. In this way, the effect becomes self fulfilling in nature whereby the prices tend to respond to these zones due to the numerous orders being executed there.
The live example of this is the crypto market in 2026. In October 2025, bitcoin fell from its all time high of $126,199 & has spent much of early 2026 between $61,000 & $76,000. The 38.2 percent retracement of the recent rally sits at approximately $70,471 & BTC found real support near that exact level after the March 2026 FOMC selloff. It is not a coincidence. This is the kind of price behavior that makes Fibonacci retracement ratios worth understanding for every investor.
Why does the 61.8% Level Matters the Most?
The 61.8 percent level is the most important of all Fibonacci retracement ratios. It is called the Golden Ratio & it attracts the highest concentration of orders from both retail & professional traders. In strong uptrends, this level acts as the deepest meaningful pullback before a recovery rally begins.
Fibonacci retracement of 61.8% is the most reliable one due to the high accumulation of orders by retail and professional traders. High accumulation of orders generates a self-reinforcing process where the reaction to Fibonacci numbers confirms the reliability of this indicator as many traders are interested in these figures. Bitcoin followed this level perfectly during its upward move from $42,000 to $58,800 in 2024. After the pullback to the 61.8% level at $48,400, the cryptocurrency showed a strong rebound & generated a 4:1 reward ratio for traders entering on time.
What is The Golden Pocket?
The zone between 50 percent & 61.8 percent is known among professional traders as the Golden Pocket. It is one of the most reliable recovery zones in all of technical analysis. The Golden Pocket combines two powerful concepts which is the 50 percent level as a psychological midpoint & the 61.8 percent Golden Ratio as the deepest healthy retracement.
When an asset enters this zone in a broader uptrend, it signals the best potential entry point for investors looking for recovery. The 50 percent to 61.8 percent zone as a whole produces the highest success rate for pullback entries in trending markets. It is especially useful in 2026 when so many assets across crypto & equities are sitting inside deep correction phases.
What are the Real 2026 Examples?
In 2026, the Fibonacci retracement ratios have shown clear real world results across markets. These are some of the most compelling live examples from recent weeks.
Bitcoin (BTC)
Bitcoin dropped from its all-time high of $126,199 all the way down to the $61,000 to $66,000 region during early to mid-2026. The 78.6 percent Fibonacci retracement line plotted from the low point of August 2024 at $49,000 to the all-time high stands at $65,520. Bitcoin has not managed to break above this level so far in 2026 & drifted down towards the 200 week Simple Moving Average line of $62,239, which is yet another major confluence level. The potential target downside of Bitcoin on a weekly close below $62,239 would be $55,777. The clear blue sky target for 2026 would be $140,259 which is the 127.2 percent Fibonacci extension of the rise from the low of April 2025.
DeXe (DEXE) April 2026
DeXe showed a textbook Fibonacci recovery example in April 2026. The coin surged 63.8 percent over seven days & traded at $15.85, sitting directly on the 0.618 Fibonacci retracement at $15.61. The next major upside target on the Fibonacci extension sits at the 0.786 level near $19.39. This is a perfect example of a Fibonacci bounce confirming a recovery signal in real time.
Ethena (ENA) April 2026
Ethena rose by 27.1 percent in one week in April 2026 following its movement above the descending trendline. The retracement from the November 2024 high of $0.3603 & the April 2026 low of $0.0765 showed the first resistance at $0.1435, which is the 0.236 retracement. A break above this level could bring about the 0.382 retracement at $0.1849 & the 0.5 retracement at $0.2184.
Conclusion
Fibonacci retracement ratios are once again showing how useful they can be in 2026, in times when the markets are undergoing periods of deep correction cycles in crypto & even beyond. The Fibonacci retracement ratios at 38.2%, 50%, 61.8% & 78.6% are the most significant levels that any investor needs to pay attention to in 2026. It is at these very levels that recovery starts taking place, where smart money is building up & the best possible trading setups emerge. The Golden Pocket region between 50% & 61.8% becomes the best possible place where asset recovery can be seen in 2026. Bitcoin, Altcoins & even the traditional assets are all adhering to Fibonacci retracement ratios perfectly in 2026. It is not magic but mathematics & also market psychology at play. Any investor who knows about the Fibonacci retracement ratios gets an extra edge.