


Key insights
- Solana seems bound to end December lower, while history favours a January bounce.
- Demand from the ETF side remains steady, but interest seems to be limited to only a few tokens.
- Analysts say that the price must hold above support or risk further weakness.
SOL’s January outlook examines whether SOL can replicate its historical pattern of 59% average returns and 22% median gains in January after a red December close. After falling 12% through December to the mid-$120 range, Solana faces mixed signals with steady $755 million in ETF inflows and treasury firms holding 5% of supply (28 million SOL), yet December saw no net treasury additions despite lower prices, creating uncertainty about whether historical January strength will materialize.
Solana is heading into the new year after a difficult December. Price fell about 12% over the past month, and traders are now watching January closely.
Historically, data show that Solana tends to recover at the start of new years.
While the current charts and flows still send mixed signals, this tension makes the next few weeks important for SOL.
Solana Closes December Under Pressure
Solana struggled through the final stretch of the year, with selling pressure persisting throughout most of December. As of writing, SOL now trades near the mid $120 range after failing to reclaim higher levels.
This setup feels familiar as Solana often ends the year weak, then surprises traders once January begins.
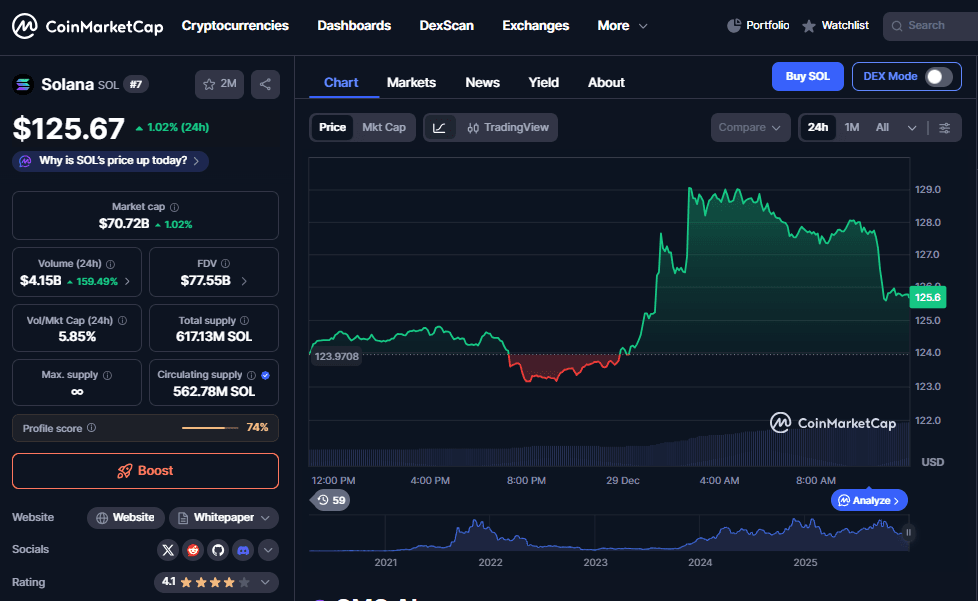
Solana seems to be closing the year under pressure | source: CoinMarketCap
Investors should note, though, that this pattern does not guarantee a repeat and market conditions feel more selective this time.
Buyers have not stepped in with force, and sellers also seem less aggressive than before. That balance keeps SOL stuck in its current range.
January History Favours Solana, But Nothing Is Certain
January stands out as one of Solana’s strongest months. The cryptocurrency’s average returns sit close to 59% while median gains hover near 22%. Historically, the pattern is often stronger when December closes red.
Past examples support this view. December 2022 ended with a near 30% drop, and January 2023 followed with a rally of about 140%. A similar rhythm played out last year, even though on a smaller scale.
This December also closed lower, and that fact alone leans bullish based on history. Still, markets do not move on statistics alone and traders need fresh demand to confirm any rebound.
ETF Flows Show Support, But Only for Select Names
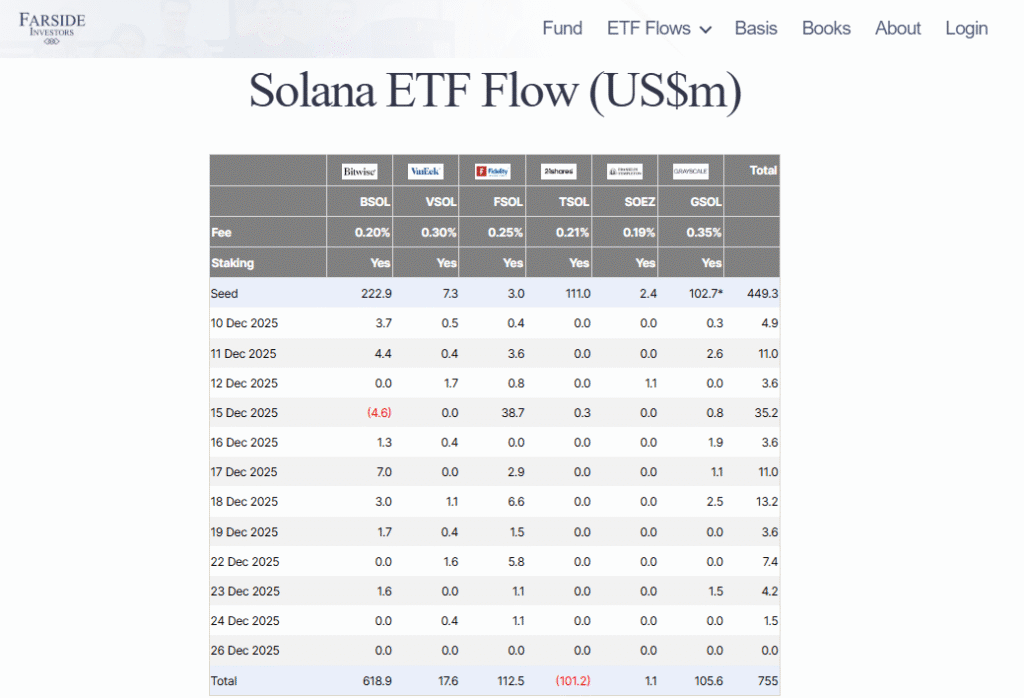
Spot Solana ETFs add another aspect to the story. Since launch, these products have not seen a week of net outflows. Recent data shows about $13 million in weekly inflows, while total inflows now sit near $755 million.
This steady demand indicates confidence in SOL, and analysts are warning against reading too much into it. Capital flows seem to favour a small group of liquid assets, and Solana and XRP stand out.
This being said, investors seem cautious and prefer assets where exits remain easy. This behaviour supports SOL without lifting the entire market.
Treasury Firms and ETFs Hold a Large Share of Supply
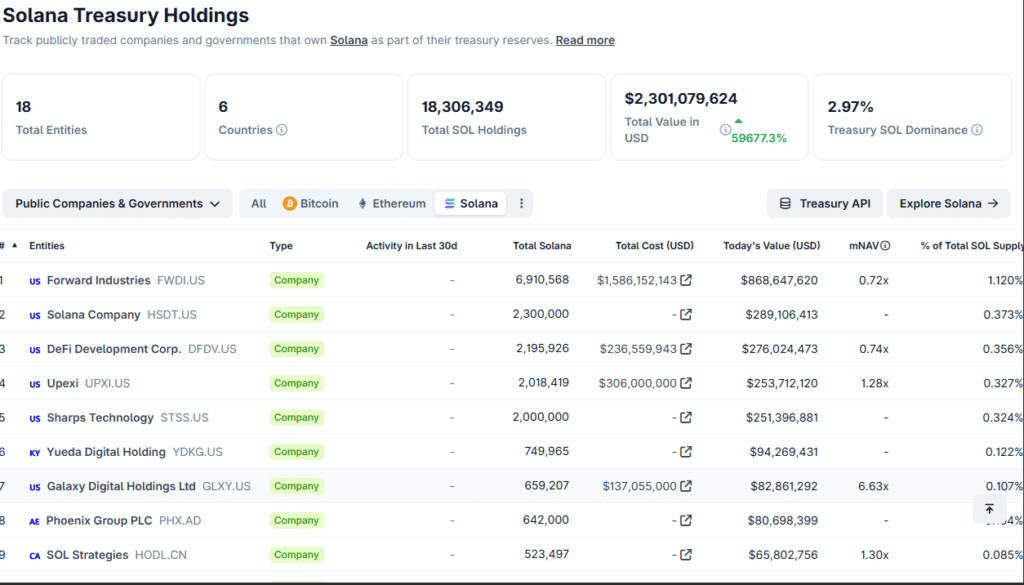
Another factor in Solana’s outlook is that treasury companies and ETFs now hold close to 5% of the circulating SOL supply. Combined reserves are also holding more than 28 million SOL.
These holdings grew through most of the year, and buying slowed in December. While this happened, treasury firms made no net additions during the month despite lower prices.
Several firms saw stock prices fall after earlier hype faded, and Forward Industries still holds large SOL reserves valued near $871 million. Its market value dropped below that figure, and this gap indicates a weaker appetite for proxy exposure.
Disclaimer: BFM Times acts as a source of information for knowledge purposes and does not claim to be a financial advisor. Kindly consult your financial advisor before investing.


