


The digital asset market is seeing an uptrend with Bitcoin crossing the $72,000 mark this week. This uptrend comes after the markets were seeing a dip in the value of Bitcoin in late February due to the high geopolitical tensions and the overall economic conditions. This uptrend in the digital asset markets is being driven by the never-ending wave of institutional demand, which saw spot Bitcoin Exchange-Traded Funds seeing their second consecutive day of positive net flows.
- Institutional Absorption Offsets Geopolitical Risk
- Technical Structure and Resistance Walls
- On-Chain Signals: A Cautious Optimism
- The “CLARITY Act” and Regulatory Tailwinds
- Altcoin Performance and Market Dominance
- Looking Ahead to Q2 2026
- Why is Bitcoin holding above $72K recently?
- How much money recently flowed into Bitcoin ETFs?
- What do the $1.47B ETF inflows indicate for the crypto market?
Also Read: Bitcoin Price Surges to Monthly Highs, Gains Over $10K Since USA-Iran Strikes Began
On Wednesday, March 4, 2026, U.S. spot Bitcoin ETFs witnessed an inflow of $155 million in fresh capital. This latest inflow is the continuation of an impressive two-week run that has seen $1.47 billion in total inflow into these investment vehicles. This uptrend is an indication that institutional investors are considering the latest dip in the value of Bitcoin to be a strategic entry point, despite the volatile state of the world economy.
Institutional Absorption Offsets Geopolitical Risk
The uptrend in the value of Bitcoin is quite impressive, especially in the context of the high geopolitical tensions in the Middle East, with the U.S., Israel, and Iran in the midst of a full-blown war. In the past, such escalations in the Middle East have led to the “Risk Off” phenomenon, in which investors turn their focus from the highly volatile markets of cryptocurrencies to the safe heavens of gold. In the past, escalations in the Middle East have seen the value of gold touching its all-time highs of $5,400/ounce, whereas the value of Bitcoin has remained stagnant.
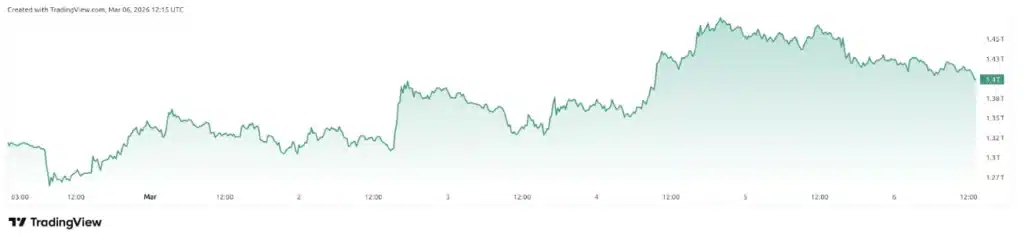
Analysts at SoSoValue and CoinSwitch pointed out that the $155 million inflow into the U.S. spot Bitcoin ETFs on Wednesday followed a massive $225 million day on Tuesday. In the first few days of March, more than $1.1 billion has been allocated to Bitcoin ETFs. This is effectively absorbing the available supply in the market, which recently hit its lowest level since 2018 at 2.6 million BTC.
Technical Structure and Resistance Walls
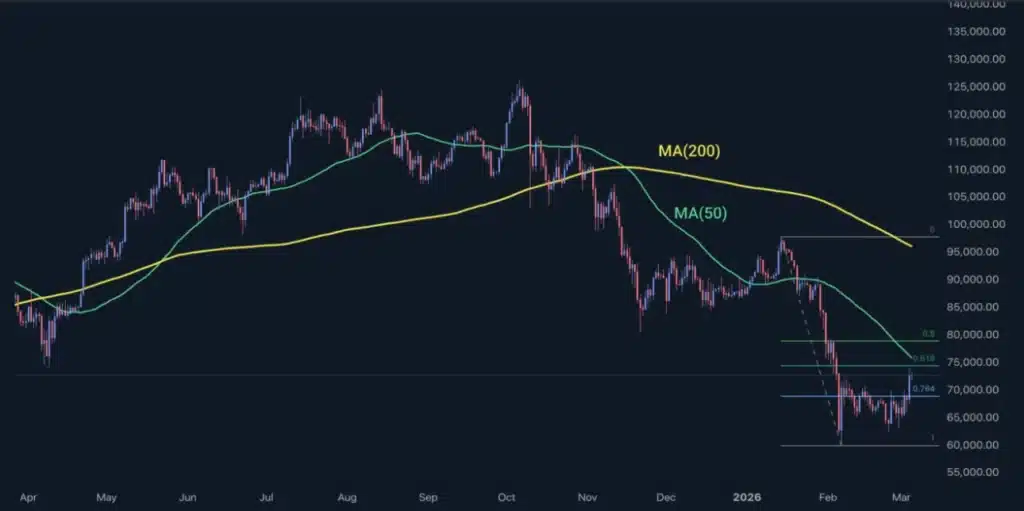
Technically speaking, Bitcoin is trying to re-establish its dominance above its 200-day Exponential Moving Average, which is currently valued at $72,604. This level has been a major resistance level throughout the last month. Finally, breaking above $72,000 came as a result of a “short-squeeze” cascade, where over $110 million worth of leveraged short positions were liquidated in a single 24-hour period.
The $73,500 to $75,000 region is now being considered as the new major resistance area. If Bitcoin is able to close above $74,500 on a weekly basis, it is expected, according to various on-chain models, that it will mathematically mean that the correction is over, and we will be starting a new run towards the $80,000 psychological level.
Renowned trader Peter Brandt recently shared his thoughts on X (formerly Twitter):
If Bitcoin is not able to hold above $70,000, we might see it re-test the $65,000 to $68,000 region.
On-Chain Signals: A Cautious Optimism
Yet, despite the significant price action, there are some on-chain metrics that indicate a level of caution is warranted. According to the on-chain data provided by Glassnode, there is still approximately 43% of the total circulating supply of Bitcoin that is “technically ‘held at a loss’ or last moved at higher price levels.” This could potentially indicate a level of ‘overhead supply’ in the Bitcoin market.
The “Fear and Greed Index” is also indicating a level of “Extreme Fear,” with a score of 19.
Yet, despite this, it is also possible that contrarian investors are using this as a level of bullish confirmation, indicating that the worst-case geopolitical risks have indeed been “priced in.”
The “CLARITY Act” and Regulatory Tailwinds
While the charts are certainly indicating a level of bullish momentum in the cryptocurrency space, there are also some positive tailwinds coming from the United States, in the way of the push towards the “CLARITY Act.” According to Akshat Siddhant, the lead quant analyst at Mudrex, this is certainly a positive sign, indicating a level of clarity and encouraging a level of accumulation in the cryptocurrency space.
Furthermore, the Coinbase Premium, or the discrepancy between the price on Coinbase and the other global exchanges, is again positive, which means the current demand is coming from institutional entities in the US and not due to a rise in other markets caused by retail investors.
Altcoin Performance and Market Dominance
market dominance is still high, at 58.16%, as the flagship cryptocurrency continues to lead the market’s overall revival. However, other major altcoins are also following suit, with Ethereum (ETH) rising above $2,100, increasing by close to 9% in the same time period. Other altcoins, such as SOL and XRP, also rose by as much as 8% as “war fears” subside, and investors look for high-beta bets in the crypto space.
Looking Ahead to Q2 2026
As we progress further into March, the key metric to watch will be whether the ETF inflow run can sustain itself. The relationship between institutional inflows and the price of Bitcoin has become the single most important driver of market structure in 2026 so far. The halving cycle being in the distant past, the marginal price setter for the price of Bitcoin is no longer the miner, but rather the authorized participants of these multi-billion-dollar ETFs.
Market players should also keep an eye on upcoming U.S. macroeconomic data, such as the ISM Services PMI and employment figures, as this may impact the Fed’s decision on liquidity levels. Though geopolitical tensions remain a “wildcard,” the $1.47 billion institutional vote of confidence over the last fortnight indicates that Bitcoin is increasingly being perceived as an essential component of the modern institutional portfolio.
Disclaimer: BFM Times acts as a source of information for knowledge purposes and does not claim to be a financial advisor. Kindly consult your financial advisor before investing.
Why is Bitcoin holding above $72K recently?
Bitcoin remains above $72,000 mainly due to strong institutional demand and consistent inflows into spot Bitcoin ETFs.
How much money recently flowed into Bitcoin ETFs?
U.S. spot Bitcoin ETFs recorded about $155 million in daily inflows, extending a strong buying streak.
What do the $1.47B ETF inflows indicate for the crypto market?
The $1.47 billion two-week inflow suggests rising institutional interest and renewed confidence in Bitcoin.


