


Pointwise Summary
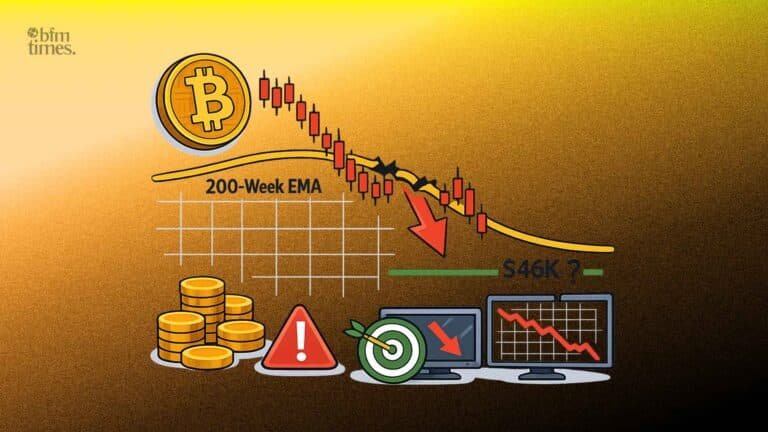
- Bitcoin recently tried a post-breakout retest of the 200-week Exponential Moving Average (EMA) but was unable to maintain those levels.
- The most recent Weekly Close was below the 200-week EMA, which technically initiated a breakdown period for this long-term indicator.
- In case Bitcoin does not recover the EMA this week, the level will become a historical support zone and a new resistance.
- According to the analysts, the 200-week EMA is currently not giving any definite support or resistance, which means that the market is extremely indecisive.
- A confirmed loss of this size can lead to additional macro downside, and traders will be looking at the $46,000 to $60,000 regions.
Deep Dive: Bitcoin Hits Pivot Point with 200-Week EMA Not Holding
Bitcoin (BTC) is approaching a critical junction this week following a technical occurrence that has attracted the attention of macro analysts. After a brief period of optimism when the price attempted to reverse the 200-week Exponential Moving Average (EMA) into an uphill pattern, the most recent weekly close has formed a less ambitious impression.
Bitcoin has been trading below the 200-week EMA. The significance of this close in the technical analysis community is that it is a failed post-breakout retest. The price has gone below the EMA, which was meant to act as a springboard to more increases, thus effectively causing a breakdown.
The Support-Resistance Flip
The impending issue for market participants is the possibility of a role reversal. In case the 200-week EMA is lost this week as support and the price produces another weekly close below it, the EMA may become new resistance. This would put a cap on any relief rallies and could trap bulls who purchased during the recent breakout.
Recent patterns on exchanges such as Coinbase and Binance indicate that Bitcoin is trading in the range of $65,500 to $66,700. The asset is already bearing the burden of this overhead barrier, with the 200-week EMA estimated at approximately the $68,300 mark.
An “Unreliable” Indicator?
The perceived lack of reliability of the 200-week EMA is one of the most vivid observations from recent price action. Historically, this moving average has been used as a line in the sand for the long-term health of Bitcoin. However, recent conduct indicates that it is losing its definite role.
This line has been crossed by the price several times in 2026 without a definite trend. This zigzag movement shows that the market is unable to take a definitive course. The EMA may remain a price-attracting force, rather than a floor or ceiling, until it can be maintained at a level significantly above or below the current mark with volume.
Scope for Another Dip
Notwithstanding the breakdown, there is still an opportunity for a second retest. Analysts indicate that Bitcoin could make another dip into the EMA to determine whether it can cement a reclaim. The breakdown narrative would be invalidated by a robust recovery from present levels and a weekly close above $68,500.
But should the “meandering” persist and the price ultimately move downward, the subsequent rational targets for a macro downside are between $46,000 and $60,000. These levels provide more structural support where long-term holders have intervened in the past.
Context: The Importance of the 200-Week EMA
In Bitcoin’s history, the 200-week moving average (both Simple and Exponential) has been the ultimate bear market bottom indicator. In 2015, 2018, and 2020, touching this line signalled the absolute end of the downtrend.
The present cycle is special since the EMA is increasing toward the price while the price is decreasing toward the EMA. The result of this convergence is a zone of high pressure. These technical levels have become even more volatile than normal in the macro environment of 2026 due to geopolitical tensions in the Middle East and changing interest rate expectations in the US.
Also Read: SEC Makes Major Changes to ETF Approval Guidelines, Halts Leveraged ETFs, Allows XRP
Frequently Asked Questions
What does a Weekly Close mean in technical analysis?
A weekly close is considered more authoritative than a daily close since it removes the noise and reflects the point where market agreement was reached after a full week of trading.
Is the loss of the 200-week EMA a new bear market?
Not necessarily. Although it is a negative indicator, Bitcoin has at times wicked or spent a short time below this line and then recovered.
How can I monitor these charts in real-time?
The weekly chart of BTC/USD with the EMA overlay can be seen on TradingView, CoinMarketCap, or even in the advanced trading interface of Coinbase. Find the tab named “Indicators” and search for “Exponential Moving Average” with the length set to 200
What will become of Bitcoin in case it crashes below $60,000?
A price of less than $60,000 would put the asset in a liquidity gap where support is relatively weak. Most analysts suggest that the next significant structural support level will be at $46,000, where historical accumulation has occurred.
Disclaimer: BFM Times acts as a source of information for knowledge purposes and does not claim to be a financial advisor. Kindly consult your financial advisor before investing.


